Overview of Canadian communities exposed to sea level rise


This report is part 1 of 4 from the NCCEH/CLIMAtlantic “Sea level rise and public health implications” project. Please see the full project description and companion reports here.
Key Messages |
|
Introduction
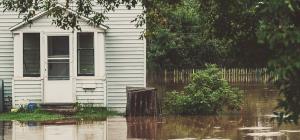
Coastal communities are being increasingly impacted by the long-term threat of sea level rise. Decades ago, powerful storms were typically the cause of coastal flooding. Now, due to rising seas, seasonal wind events and high tides can cause more frequent flooding of coastal communities. This affects homes and businesses, overloads stormwater and wastewater systems, and can cause infiltration of saltwater into coastal groundwater sources,1 all of which can have impacts on human health.
The National Collaborating Centre for Environmental Health (NCCEH) is seeking to better understand the public health impacts of sea level rise in Canada, and to identify how the impacts are addressed in current community-based tools such as local Climate Change Adaptation Plans (CCAPs). The findings will be used to examine how public health perspectives can be used to help communicate risks and identify adaption measures to reduce the adverse impacts of sea level rise in the most vulnerable communities. While the intent of this report is to consider Canadian communities at risk of exposure to long-term sea level rise, it is recognized that coastal hazards such as storm surge, erosion, permafrost melt, and flooding will be exacerbated in the short and medium term by rising sea levels. It is the combination of these physical factors, as well as a wide range of socioeconomic factors that determine the vulnerability of coastal communities. As a first step, this report provides an overview of Canadian communities most at risk from sea level rise for public health and climate adaptation practitioners.
This report is part 1 of 4 from the NCCEH/CLIMAtlantic “Sea level rise and public health” project. Please see the full project description and companion reports here.
Project Approach
Defining sea level rise
As average global temperatures increase, global sea levels have been rising due to meltwater volume added from glaciers, polar ice caps, and ice sheets, as well as through thermal expansion of warming ocean waters.2 Though sea level rise is a global phenomenon, coastal areas around the world and even within Canada will experience differing levels of rising seas. In Canada, sea level rise is modified by glacial isostatic adjustment in some areas – that is the vertical land motion that is a delayed response to the end of the last ice age.2 As a result, some areas of Canada’s coastline are experiencing uplift in land elevations; such is the case in Hudson’s Bay and much of the Canadian Arctic Archipelago. Other areas of Canada’s coastline are experiencing subsidence where the land is sinking, which is the reality for the Beaufort Sea region and the Atlantic coast. In addition, certain areas of British Columbia are experiencing subsidence due to the weight of alluvial deposits (river sediment washed into the basin from upstream) from the Fraser River. Because of this vertical movement of land, Canadian coastlines will have different relative exposure to sea level rise and experience varying impacts that may result from that exposure.
The regions most exposed to sea level rise in Canada were identified based on the 2021 report by the Geological Survey of Canada, and replicated in Figure 1[1].2 These projections are “worst-case scenario” based on the Intergovernmental Panel on Climate Change (IPCC) in its Fifth Assessment Report using the Representative Concentration Pathway (RCP) 8.5 to the median projection including an enhanced sea level rise of 65 cm to accommodate projected additional meltwaters from Antarctica.
[1] Figure 1 was reproduced from the Geological Survey of Canada’s Relative sea level rise projections for Canada based on the IPCC Fifth Assessment Report and the NAD83v70VG national crustal velocity model by TS James, JA Henton and M Craymer. Figure 5, p. 11 https://geoscan.nrcan.gc.ca/text/geoscan/fulltext/of_8764.pdf.2 This reproduction is a copy of an official work that is published by Natural Resources Canada (NRCan) and has not been produced in affiliation with, or with the endorsement of, NRCan.
Figure 1: Projected relative sea level rise in Canada by 2100

Exposure to sea level rise
Canada has more than 226,000 kilometres of coastline, with 38,000 kilometres in the four Atlantic Provinces (New Brunswick, Nova Scotia, Prince Edward Island, and Newfoundland and Labrador), 26,000 kilometres in British Columbia, and a staggering 162,000 kilometres of coastline in Canada’s Arctic.
In a 2019 global analysis of population vulnerability to sea level rise and coastal flooding, Kulp and Strauss estimated there to be 320,000 to 600,000 people in Canada who currently occupy land that is subject to sea level rise and coastal flooding.3 This research further suggests that by 2100, under a high emissions scenario (RCP8.5), there will be between 480,000 and 840,000 people living in regions exposed to sea level rise in Canada. This is a conservative estimate as it does not include the potential for enhanced sea level rise (anticipated meltwater contribution from the Antarctic Ice Sheet).
The many First Nation communities whose traditional lands are situated along Canada’s coastline are also exposed to sea level rise and the associated impacts from permafrost melt, erosion, and storm surge. While Indigenous communities in the north will be facing many challenges related to climate change, the impact of sea level rise specifically will likely be felt more by First Nation communities along the Atlantic and Pacific coasts.
Below we describe the geographic distribution of regions with highest risk of exposure to sea level rise in Canada and highlight some of the most vulnerable communities. The method used to identify these communities involved discussions with provincial and territorial experts in climate change and corroboration of sea level rise risk from www.Climatedata.ca.4
Findings
Which Canadian coastal communities are most exposed to sea level rise?
Atlantic Canada
Figure 2: Selected coastal communities in Atlantic region exposed to sea level rise.

While each province in Atlantic Canada has unique geography, coastal geomorphology, and socio-economic history, settlement along or near the extensive coastline is common. Figure 2 demonstrates that much of Atlantic Canada, and in particular, New Brunswick, Nova Scotia, and Prince Edward Island, will be exposed to the highest rates of sea level rise in Canada by 2100. With a total population nearing 2.5 million, it is estimated that at least 25%, or more than 600,000 people, live within 20 kilometers of the Atlantic coastline - some located on high cliffs not exposed to sea level rise, while others are more vulnerable as they are located at sea level.2 With the exception of the Halifax Regional Municipality and the City of Charlottetown, the majority of the Atlantic coastline tends to be rural and sparsely populated; however, there are growing development pressures along all Maritime coastlines. In addition, southwestern regions of Newfoundland and Quebec’s Les Îles-de-la-Madeleine are also highly exposed to sea level rise and its impacts. Table 1 provides a quick overview of the key regions and examples of communities most exposed to sea level rise in the Atlantic. Population demographics as well as population density are used to reflect the degree of exposure from a public health perspective.
Table 1. Examples of Atlantic coastal communities most exposed to sea level rise
|
Region |
Community examples |
SLR estimates to 2100[1] |
Population[2] |
Population density (people/km2) |
|
Acadian Peninsula / Chaleur Region (NB) |
Gloucester County (Beresford, Bathurst, Le Goulet, Shippagan, Sainte-Marie-Saint-Raphael, Bas Caraquet, Maisonnette) |
148 cm |
78,256 |
16.5 |
|
Northumberland Strait (NB/PEI)
|
Shediac (NB) Pointe-du-Chêne (NB) Summerside (PEI) Borden-Carleton (PEI) Victoria (PEI) Charlottetown (PEI) |
146 cm 146 cm 146 cm 146 cm 148 cm 152 cm |
7535 767 16,001 1600 226 38,809 |
117.7 333.3 567.2 60.9 59.0 42.2 |
|
Chignecto Isthmus (NB/NS) |
Amherst (NS) Sackville (NB) |
148 cm 148 cm |
9404 6099 |
2.8 82.5 |
|
Atlantic Coast (NS) |
Lunenburg County (Lunenburg, Mahone Bay) Halifax County Richmond County (Cape Breton) |
157 cm
164 cm 175 cm |
48,599
440,072 8914 |
16.7
80.3 7.2 |
|
Gulf of St. Lawrence (PE/QU) |
Souris (PEI) Îles de la Madeleine (QU) |
157 cm 156 cm |
1079 12,190 |
299.0 78.6 |
|
Southwest Newfoundland (NL) |
Stephenville (NL) |
150 cm |
6540 |
185.4 |
|
Placentia Bay (NL) |
NL Census Division 2 (Burin Peninsula, NL) Argentia/Placentia (NL) |
149 cm
148 cm |
19,392
3289 |
3.3
56.9 |
Indigenous communities with lands along coastlines in the Maritime Provinces that are exposed to sea level rise, are made more vulnerable due to a combination of geographic, social, and cultural factors. A selection of the most exposed First Nations communities in the Atlantic region are highlighted in Table 2.
Table 2: Selection of First Nation coastal communities in the Atlantic exposed to sea level rise
| Region | Community Examples | SLR estimates to 2100[1] | Population[2] |
| Gulf Coast (PEI) | Lennox Island First Nation | 146 cm | 325 |
| Chaleur Coast (NB) | Ugpi’ganjig First Nation | 138 cm | 415 |
| Northumberland Strait (NS) | LnuiMenikuk First Nation | 151 cm | 135 |
| Pictou Landing First Nation | 157 cm | 485 | |
| Cape Breton (NS) | Potlotek First Nation | 163 cm | 505 |
[1] These are enhanced estimates relative to 2006 for RCP8.5 to 2100 based on the 2021 projections
[2] First Nations population estimates in this report are taken from First Nation profiles.6
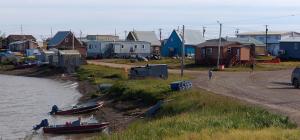
Canada’s North
Figure 3: Communities exposed to sea level rise in the Beaufort Sea (NWT)
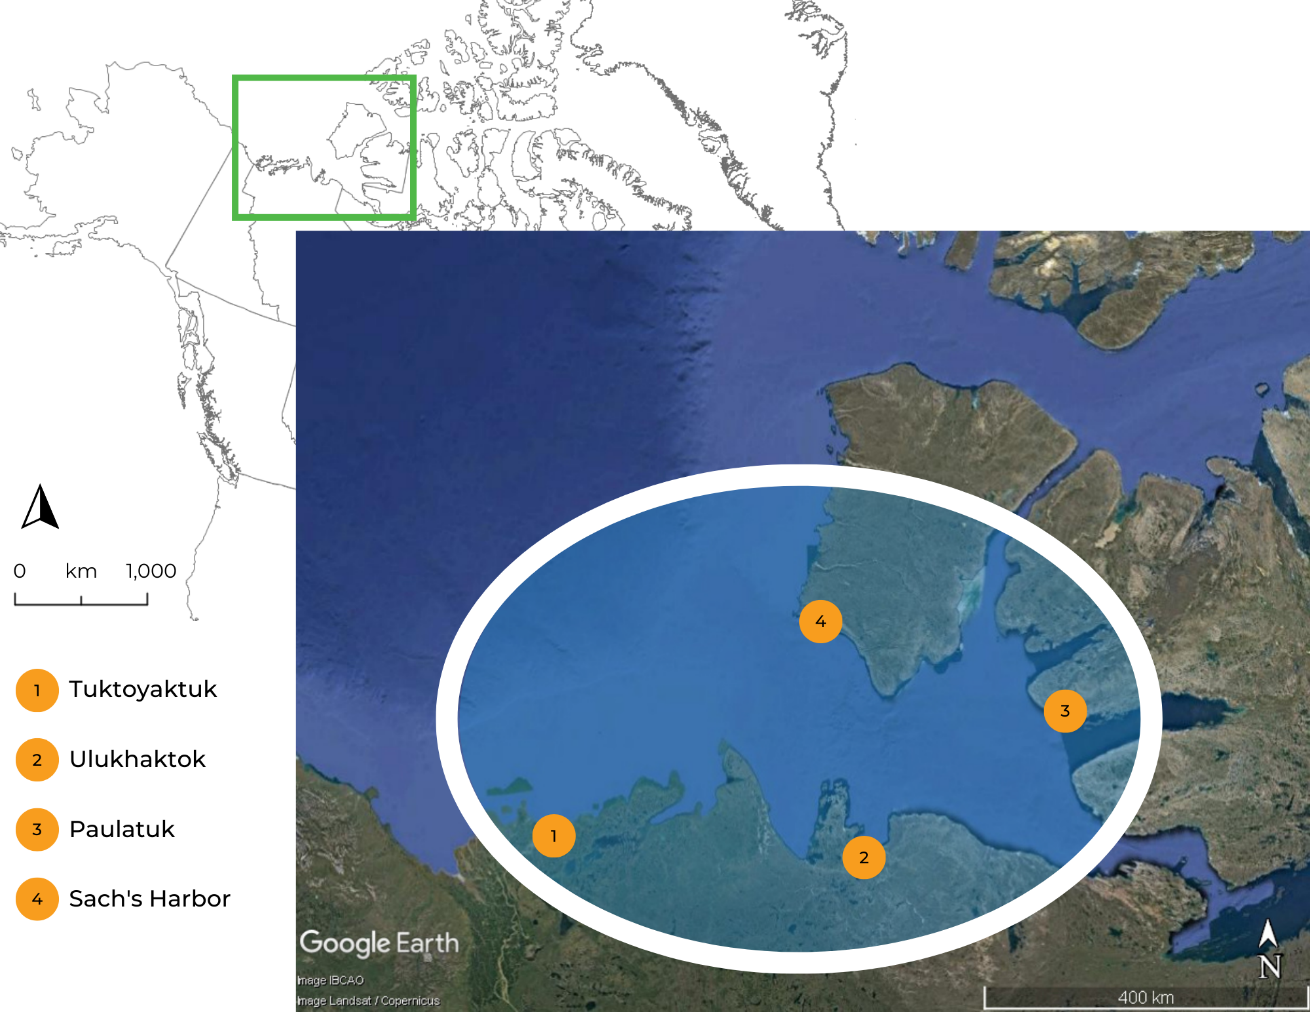
While the Canadian Arctic Archipelago has 162,000 kilometres of coastline, it will have a relatively low exposure to sea level rise because the isostatic rebound of lands from the last ice age is raising land elevation in most of the region. Much of the coastline is uninhabited, which also limits impact to settlements and human health. The areas most at risk in the north are those around the Beaufort Sea near the northern regions of the Yukon and Northwest Territories, as illustrated in Figure 3. Facing particular vulnerability is Tuktoyaktuk, which is situated on a low-lying peninsula that is already exposed to coastal erosion and flooding. Table 3 provides a brief overview of four communities in the Northwest Territories most exposed to sea level rise.
Table 3. Coastal communities in Northwest Territories most exposed to sea level rise
| Community | SLR estimates to 2100[1] | Population | Population density (people/km2) |
| Tuktoyaktuk | 144 cm | 937 | 74.0 |
| Sach’s Harbour | 132 cm | 104 | 0.4 |
| Ulukhaktok | 85 cm | 408 | 3.4 |
| Paulatuk | 106 cm | 298 | 4.7 |
[1] These are enhanced estimates relative to 2006 for RCP8.5 to 2100 based on the 2021 projections
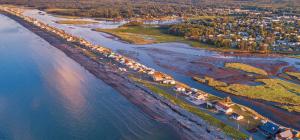
Canada’s Pacific Coast
Figure 4: Examples of Pacific coast communities exposed to sea level rise

[f] These are enhanced estimates relative to 2006 for RCP8.5 to 2100 based on the 2021 projections
In addition to being one of the most populated regions in Canada, the metropolitan area of Vancouver is one of the most exposed to sea level rise, as illustrated in Figure 4. Being geographically situated between Burrard Inlet, the Salish Sea, and the Fraser River, the region is at risk of sea level rise as well as increasing storm surge and coastal flood events. Lying at the mouth of the Fraser River, about half of the City of Delta’s land area is less than 1.5 m above mean sea level and a 61-kilometre dike system defends these areas from coastal and riverine flooding. Further north along the British Columbia coastline, the District of Squamish is also exposed to sea level rise. If sea level rise meets its average forecast of 1 m by 2100, more than 311,000 people will be displaced and seeking shelter in British Columbia.7 As well, the southern tip of Vancouver Island and Haida Gwaii are exposed to sea level rise. Tables 4 and 5 provide a brief overview of population and density as well as sea level rise estimates for these regions.
Table 4: Pacific coast populations exposed to sea level rise
|
Exposure Region |
Community examples |
SLR estimates to 2100 |
Population |
Population density (people/km2) |
|
Census Metropolitan Area of Vancouver |
Vancouver, Surrey, West Vancouver, Port Moody, North Vancouver Delta Richmond |
125 cm
130 cm 128 cm |
2.6 million |
918.0
|
|
Howe Sound |
Squamish District Mun. |
115 cm |
23,819 |
227.5 |
|
Southern Vancouver Island |
Victoria Oak Bay District Mun. Saanich District Mun. |
130 cm 130 cm 130 cm |
91,867 17,990 117,735 |
4722.3 1710.0 1136.6 |
The Pacific coast of Canada is home to many First Nation communities, many of which are established in coastal areas and islands that are highly exposed to sea level rise. Table 5 highlights a selection of some of those most exposed communities, also identified in Figure 4.
Table 5: Selection of Pacific First Nation communities exposed to sea level rise
| Region | Community Examples | SLR estimates to 2100 | Population |
| Haida Gwaii | Skidegate Band Council | 132 cm | 835 |
| Old Massett Village Council | 136 cm | 555 | |
| Delta | Tsawwassen First Nation | 130 cm | 750 |
| Musqueam Nation | 127 cm | 1660 | |
| Burrard Inlet | Tsleil-Waututh | 126 cm | 1855 |
| Squamish | 115 cm | 4060 | |
| Vancouver Island | Tsawout First Nation | 130 cm | 1685 |
Summary
According to high emission projections for relative sea level rise, the Atlantic coast, the coast of the Beaufort Sea, and the cities of Metro Vancouver are the regions that will be most exposed to rising seas in Canada. These regions may experience sea level rise of up to 175 cm by 2100, which will have dramatic consequences for low-lying coastal communities. Many Indigenous communities are situated throughout these vulnerable coastlines.
The risk to human health in such communities must be considered within the broader context where sea level rise exacerbates coastal hazards such as storm surge, erosion, permafrost melt, and flooding, and increases the vulnerability of these communities from a socio-economic perspective. Sea level rise may force displacement of some communities to less impacted areas, causing disruption of daily life, livelihoods, and community cohesion. Understanding the health impacts of these hazards will be considered in the next section.
Acknowledgements
We would like to express our appreciation to the NCCEH staff, particularly Juliette O’Keeffe for her guidance in developing this overview report. Thanks also to CLIMAtlantic team members Sabine Dietz, Réal Daigle and Cassandra Gautreau for their invaluable input. We also thank ClimateData.ca for providing climate information used in this paper.
References
- Sweet W, Hamlington B, Kopp R, Weaver C, Barnard P, Bekaert D, et al. Global and regional sea level rise scenarios for the United States: updated mean projections and extreme water level probabilities along U.S. coastlines. NOAA Technical Report NOS 01. Silver Springs, MD: National Oceanic and Atmospheric Administration; 2022 Feb. Available from: https://oceanservice.noaa.gov/hazards/sealevelrise/noaa-nos-techrpt01-global-regional-SLR-scenarios-US.pdf.
- James T, Robin C, Henton J, M C. Relative sea-level rise projections for Canada based on the IPCC Fifth Assessment Report and the NAD83v70VG national crustal velocity model. Ottawa, ON: Geological Survey of Canada; 2021. Available from: https://doi.org/10.4095/327878.
- Kulp S, Strauss B. New elevation data triple estimates of global vulnerability to sea-level rise and coastal flooding. Nat Commun. 2019 Oct;10(4844). Available from: https://doi.org/10.1038/s41467-019-12808-z.
- ClimateData.ca. Climate data for a resilient Canada. ClimateData.ca, created through a collaboration between the Pacific Climate Impacts Consortium (PCIC), Ouranos Inc., the Prairie Climate Centre (PCC), Environment and Climate Change Canada (ECCC) Centre de Recherche Informatique de Montréal (CRIM) and Habitat7; [cited 2022 Jul 2]; Available from: https://climatedata.ca/.
- Statistics Canada. Census profile, 2021 census of population. Ottawa, ON: Statistics Canada; [updated 2022 Jul 26; cited 2022 Aug 16]; Available from: https://www12.statcan.gc.ca/census-recensement/2021/dp-pd/prof/index.cfm?Lang=E.
- Crown-Indigenous Relations and Northern Affairs Canada. First Nation profiles. Ottawa, ON: Government of Canada; [updated 2021 Dec 7; cited 2022 Aug 16]; Available from: https://fnp-ppn.aadnc-aandc.gc.ca/fnp/Main/index.aspx?lang=eng.
- Cheung C, Gamage M. Fighting floods, or living with water? The Tyee. 2022 Jun 22. Available from: https://thetyee.ca/News/2022/06/20/Fighting-Floods-Living-With-Water/.