Putting radon on the map: A new and interactive tool for British Columbia

Although there are approximately 3,000 lung cancer deaths in Canada attributable to indoor radon exposure each year,1 there is limited awareness of radon as a health hazard and how exposure to high indoor levels of indoor radon can be mitigated. The British Columbia Centre for Disease Control (BCCDC) has developed a new interactive map of indoor radon concentrations, allowing users to visualize the estimated proportion of British Columbia homes that are exposed to different levels of radon.
Radon gas is colourless and odourless, and breathing in radon does not cause any immediate health effects – it is long-term exposure to radon that increases the risk of developing lung cancer in the future. Therefore testing is the only means to determine how much radon is in a home. Importantly, the effect modification between radon and smoking produces a synergistic effect for lung cancer risk.2 Consequently, even at lower levels of radon exposure, those who smoke have a many-fold increase in lung cancer risk due to radon compared to those who do not smoke.
The purpose of this map is to inform British Columbians about radon levels in the province. Public health professionals can also use this map to inform and support their regional or community radon programming, particularly around testing for those living in areas with high levels of radon and for those who smoke.
The BC radon map is a visual tool to convey risk levels
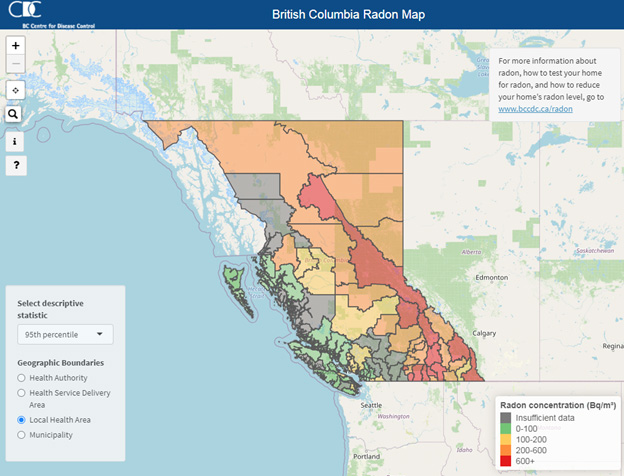
Four ranges of radon concentrations are shown with different colours: 0-100 Bq/m3 in green, 100-200 Bq/m3 in yellow, 200-600 Bq/m3 in orange, and 600+ Bq/m3 in red. The concentrations in the 200-600 Bq/m3 and 600+ Bq/m3 ranges are most important to visualize, as they represent concentrations for which Health Canada recommends remediation within 2 years and 1 year respectively.3 Estimates of median and 95th percentile of indoor radon concentration show how much radon most people in the selected region are exposed to, and how much radon those with the highest levels in the region are exposed to, respectively.
These estimates are available at the level of the Health Authority, Health Service Delivery Area, Local Health Area, and municipality, allowing users to see local data as well as larger regional differences. By clicking on each region or municipality, information is provided about the estimated proportion of homes in that region or municipality with each range of radon concentration. Sample sizes for each region and municipality are provided, and where there was an insufficient sample size (<20), the area is displayed in grey. By using a colour scheme to represent radon concentration by region, with grey representing regions and municipalities with fewer than 20 readings, public health professionals can visualize where there is higher risk of radon exposure and greater need for testing across the province. Further action can then be taken within their community or be integrated into their regional radon strategy (e.g., advocate for more testing; education campaigns, etc.).
This map also provides an estimate of lifetime risk for lung cancer in never smokers and ever-smokers for different ranges of radon exposure, as estimated by Health Canada.4 At the 0-100 Bq/m3 range, the lower estimate of lifetime risk for lung cancer is 1%, and for ever-smokers, this risk goes up to 12%. At 100-200 Bq/m3 the risk is 1.5% for never-smokers, and 15% for ever-smokers. At 200-600 Bq/m3, the risks are 2% and 17% respectively, and above 600 Bq/m3, they are 4% and 26%. By including this messaging about radon and smoking in our map, we can better inform those who smoke or are ever-smokers about their health risks, and provide another reason to quit and a reason to test for radon.
Data and calculations for the map
Radon readings used to generate the map are from residential buildings in BC and are stored in the British Columbia Radon Data Repository (BCRDR). The BCRDR is a provincial database, also developed at the BCCDC, that integrates indoor radon concentrations and related data from multiple datasets into a single location.5 Acquired through data sharing agreements with a number of government agencies, private companies, industry professionals, non-government organizations, and research groups, the BCRDR houses over 17,000 anonymized indoor radon readings from across the province. Readings are from both residential and non-residential buildings (e.g., schools, daycares, commercial buildings, and health care facilities), although only residential readings are used in the map to provide information more specific to homeowners who are in a position to choose testing. Over 15,000 of the readings were measured using long-term testing devices that produce a more accurate indication of the average radon concentration.
The data sharing agreements are ongoing to enable continuing addition of radon readings to the BCRDR. The map is therefore periodically updated to include the new readings. Non-identifiable data from the BC Radon Data Repository can be released for approved research and health protection projects, and the data request application and related information can be found here.
Where multiple measurements from the same residential building are available in the BCRDR, the levels from the lowest floor of the building are used for the map. To account for variable precision among radon monitors, all data are rounded to the nearest 10 Bq/m3. For each region or municipality with a minimum of 20 measurements, statistical modelling of the concentrations is used to estimate the number of unmitigated homes in each radon concentration category as displayed on the map.
With the availability of an accessible and interactive map such as this one, we hope to raise greater awareness for radon as a potential health hazard that can be remediated, to encourage radon testing in those living in areas with higher levels of radon and those who smoke, and to provide a key source of information to support public health professionals in their radon strategy. The map can be found at www.bccdc.ca/radon.
References
- Chen J, Moir D, Whyte J. Canadian population risk of radon induced lung cancer: a re-assessment based on the recent cross-Canada radon survey. Radiation protection dosimetry. 2012 Nov 1;152(1-3):9-13.
- National Research Council (US) Committee on Health Risks of Exposure to Radon (BEIR VI). Health Effects of Exposure to Radon: BEIR VI. Washington (DC): National Academies Press (US); 1999. [cited 2021 Nov 10]. Appendix C, Tobacco-Smoking and Its Interaction with Radon. Available from: https://www.ncbi.nlm.nih.gov/books/NBK233257/
- Health Canada. Guide for Radon Measurements in Residential Dwellings (Homes): Minister of Health; 2017. [cited 2021 Nov 9]. 24 p. Cat.: H128-1/08-543-2E-PDF. Available from: https://www.canada.ca/en/health-canada/services/publications/health-risks-safety/guide-radon-measurements-residential-dwellings.html
- Chen J. Canadian individual risks of radon-induced lung cancer for different exposure profiles. Canadian journal of public health. 2005 Sep;96(5):360-3.
- Trieu J, Henderson S. The BC Radon Data Repository (BCRDR): Developing a provincially integrated database: BC Centre for Disease Control Environmental Health Services; 2021. [cited 2021 Nov 9]. 31 p. Report No.: 1. Available from: http://www.bccdc.ca/Health-Info-Site/Documents/BCRDR_HC_report.pdf
Acknowledgements
The author would like to thank Dr. Tom Kosatsky, Dr. David McVea, and Jeffrey Trieu, with BC Centre for Disease Control Environmental Health Services who reviewed and gave input on this article.
Author
Dr. Cheryl Young is a Public Health and System Preventive Medicine resident at the University of British Columbia School of Population and Public Health. She is also a family physician in Vancouver.
Citation
Related Resources
Citizen perspectives on built, policy, and social environment changes aimed at healthy eating and active living
 view
viewPractices and inspiration for sustainable transportation equity: Case studies from Canadian cities
 view
viewINTerventions, Equity, Research and Action in Cities Team (INTERACT): Research and knowledge translation for scaling our understanding of health and the built environment
 view
view